(Experience from an AI-Based Fintech KYC SaaS Startup Focused on LATAM and Africa)
Your regular challenge: When Sales, Marketing and IT Speak Different Languages
Our SaaS startup served emerging fast-paced fintech markets (it still is). Speed + compliance were existential. Since most startups live on venture capital with limited runway, every delay in shipping value to the market means lost clients and regulatory risk. It also a huge roadblock on your path to become self-sustainable. So you need to be super frugal and efficient.
Not our case though. Our 85th percentile feature lead time (from creation to shipping) was 244 days. That is eight months from idea/proposal to production for most important features. Sales enabled our growth and promised features to close deals, engineering juggled shifting priorities, deadlines were missed. It’s really nothing new in our industry so here’s how we turned the ship around.
How We Broke the Cycle: Collaborative STATIK Workshop
Ever heard of Kanban-method? It’s a huge topic, but we’ll take the very starting part of applying it. I regularly host meetups on Kanban and metrics, so it’s natural for me to apply the method to anything.
At the time I was responsible for Product Ops at Metamap on a quest to create transparent system that helps our org of 500 people work super-aligned. So initiated a Value Stream Mapping workshop with the hint of STATIK (Systems Thinking Approach to Introducing Kanban) workshop. It’s a facilitated session that brought together Sales, Product, and Engineering. Here’s how you do it:
- Organize a collaborative session in miro/figjam or offline.
- Map out the real workflow of how you ingest feature requests.
- Reflect and agree how you evaluate and process Feature Requests at every single stage.
- Include artefacts, roles, and events required.
Our key was to understand concerns and work towards mutual goals as one team.

We mapped the real workflow. We surfaced pain points. We made visible the choke points that were slowing us down (As Is). Then discussed what adjustments need to be made, for the process to be transparent and efficient (To Be). This collaborative approach ensured everyone-from Sales to IT-understood and trusted the process. Here are the outcomes:
Step 1: Centralize Requests with a Single Source of Truth
Tools: Jira Product Discovery integrated with Salesforce and Gong.

- Intake: Every feature request should have a linked Feature Intake ticket in Jira. You can automate creation from Salesforce or Gong (linked to client deals or call notes), but essentially just make sure that you have required relevant info in your task-tracker:
- Linked Client (Active/Churned/Prospect, synced from Salesforce)
- Expected ARR Impact (from Salesforce deal size)
- Client Tier (Enterprise, MSME, or high-risk segment)
- Live status:
- If a client churned, their linked requests were automatically moved to Parked.
- Sales, Product, and Engineering all saw the same real-time status, eliminating shadow requests and misalignment.
Note that we used Jira product discovery due to our Engineering using Jira. There’s also a neat feature called “Insights.” You can connect integrations and link where merchants asked for a feature in an Email, Slack, or Salesforce. This provides you with an overview of all requests related to the feature.
Step 2: Triage with the “3×3 Rule”

A feature advanced only if:
- 3+ active or prospect clients requested it
- Ideally, with an Expected ARR ≥ $X (you can agree on what an X can be. At the very least it should align with your ROI calculations).
- The logic here is to ensure you filter out small merchants requests. You can review the stats for your company on churn rates for Small, Medium, and Enterprise businesses. This will help you understand why filtering out smaller merchants’ requests with small ARR is critical.
- Direct alignment to at least one North Star Metric (NSM)
How it worked:
- Weekly cross-functional triage meetings for reviewing Inflowing Feature Requests (Sales+Marketing, Product, IT)
- Features scored with ICE (Impact, Confidence, Ease) – but
- If a feature failed any rule, it was parked or dropped
- Surely there are exclusions – e.g. it’s a huge enterprise unlocker for us, even at negative ROI, but this should happen rarely – no more than once in 5-6 months)
This helped Sales to quantify value and ensured IT only worked on what truly mattered for growth and retention.
Step 3: Visualize and Govern with Throughput Metrics
Key metrics:
- Throughput: Features shipped per month.
- 85th percentile lead time: Tracked and shared (goal: ≤90 days – since we lived in Quarterly Planning Roadmaps)
- NSM-aligned work: Target ≥70% of shipped features
How we governed:
- Work-in-Progress (WIP) limits: No more than 2 features per team (cross-functional 7-9 person) at a time
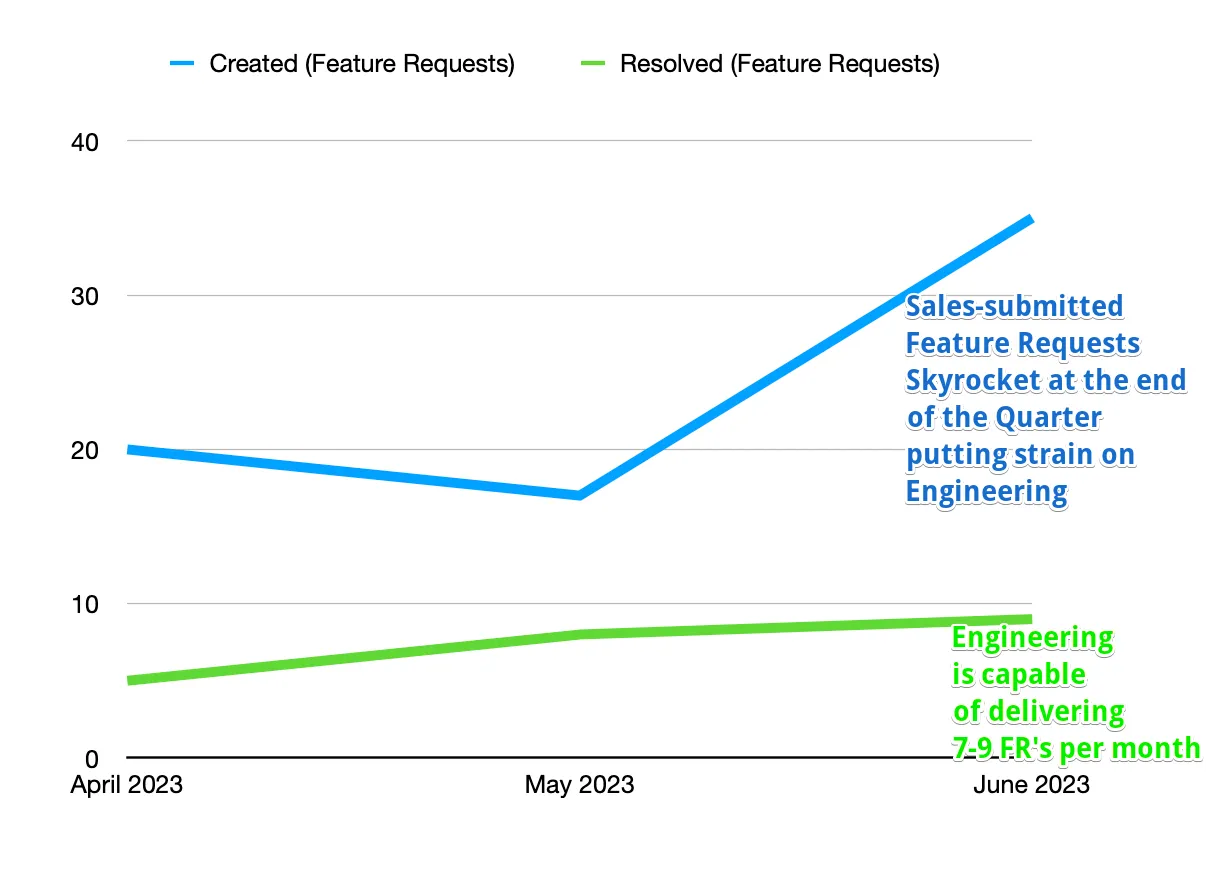
- Real-time analytics: Stats on throughput and utilization of team’s resources were visible to everyone. This visibility showed how new requests would affect delivery timelines.
This transparency enabled honest trade-offs: if someone wanted a new feature, they saw what would be delayed or dropped. Data clearly helped us to see that Engineering can process only 1/4th of Feature Inflow. That gives you great leverage. You can prioritize what’s really moving the needle for our Product Goals. This includes not only finance metrics but also our longer-term vision.
We used T-Shirt sizes and feature lead time to understand which capacity we had, but there are plenty other options.
Step 4: Validate Before You Build
There are plethora of methods, but I find the easiest ones are:
- Fake Door Tests: Add a button or UI element to gauge client interest before building the full feature
- Concierge MVP: Manually deliver the feature for a few clients to confirm value
Main point is features should be only moved to development after validation with real clients. If a client churned during validation, the feature should be dropped or de-prioritized.
Step 5: Post-Launch Accountability
Every feature had a field with when it’s expected to generate desired outcome. General idea was to prove its impact within 90 days of release, although enterprise deals can take 180-240 days to ratify:
- Adoption rate: Did clients actually use it?
- Effect on NSM: Did it move retention, revenue, or product metrics?
- Client feedback: Were there measurable improvements in satisfaction or churn?
Features that failed to deliver impact were sunset or re-evaluated. Because supporting them also requires hefty dev + CSM effort.
We reviewed our Feature Outcomes at Monthly Business Reviews (MBR) and Quarterly Business Reviews (QBR). We assessed how each feature contributed to our OKRs.
The Results: Trust, Speed, and Predictability
- 85th percentile lead time: Dropped from 244 to 93 days-now features could reliably (welp, more or less 🙂 ship within a quarterly planning cycle
- Transparency: Sales, Product, and Engineering shared a single view of priorities, status, and trade-offs
- Alignment: 76%+ of shipped features were directly tied to North Star Metrics and active client demand
- Trust: Sales stopped overpromising, and IT regained confidence and morale
3 Rules for Building Trust and Speed
- Integrate your systems: Connect Salesforce, Gong, or whatever you use to your ticketing system. This could be Jira or some other stack. This integration ensures client status and value are always visible and relevant.
- Enforce prioritization discipline: Only build what’s validated by multiple clients and aligned to your North Star. We often focus too much on building what clients want. This can move us further away from Strategic Vision. Retail the balance.
- Measure relentlessly: Track throughput and lead time, and make the numbers visible to all. It removes emotions and assumptions, helps to build data-driven culture.
Your First Step
Audit your current feature pipeline:
- How many requests are tied to active, high-value clients?
- What’s your real 85th percentile lead time?
- Are Sales and IT working from the same source of truth?

If the answers are uncomfortable, you’re not alone. But you can fix it-one step at a time. You can review your data from jira or any other system using https://predictable.team — an app designed to give you insights on your team’s performance.

One thought on “Product Operations: simple steps to build transparent Feature Pipeline to dramatically lower Lead Time”